

Mark O’Neill | May 2024 |
The purpose of an AHRC-funded network is not so much to do new research, as to gather an interdisciplinary team which will explore what is already known about an issue from new and different perspectives which are likely to aid understanding. This is done with two purposes in mind
- To set out a research agenda which will bring new insights to the subject area – in this case museum visiting and non-visiting
- To enlist scholars, especially from disciplines which have been less involved in studying the topic, in helping to address the research agenda
A good example of the kind how this stimulating shift in perspective can work happened recently in our network.
Museum Visiting and Social Inequality
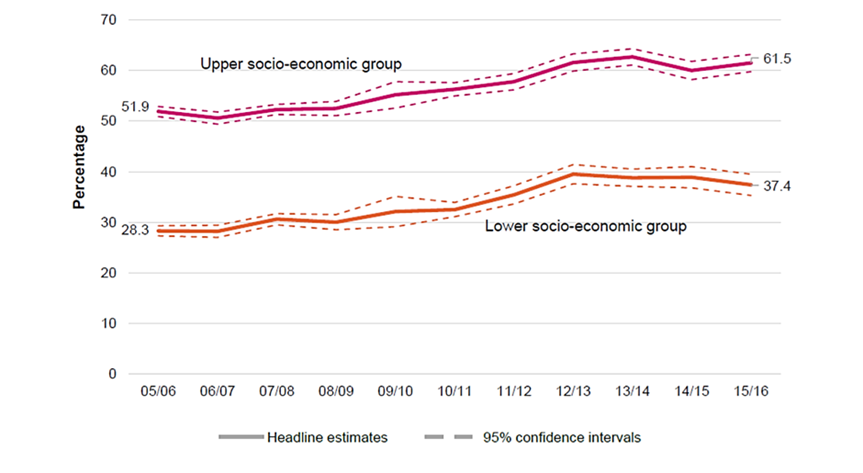
In the Taking Part Survey Focus On report on Museums and Galleries issued in 2017, the chart below (Figure 1) appeared.
It showed that attendance by those who visited museums at least once in the previous year increased amongst all social groups, but that the gap between Upper and Lower Socio-economic Groups (USEGs and LSEGs) remain more or less constant at c24 percentage points. Later editions of Taking Part show that this gap continues up to the present, and may have increased slightly (an increase is apparent, but it is within the margin of error). Understanding this persistent inequality is the focus of our research network – in the hope that understanding it will help us identify strategies for reducing it.
Another Reading
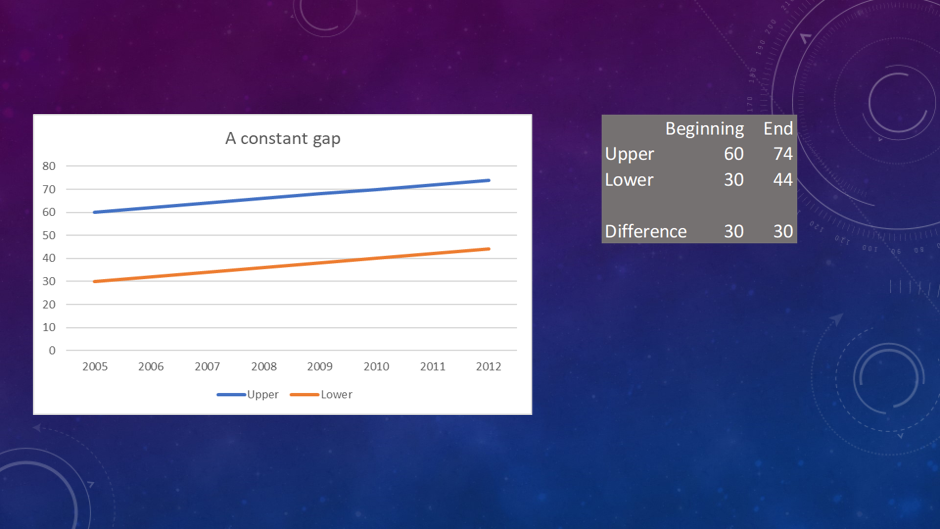
At a recent network workshop, Dr David Bartram, Associate Professor of Sociology in the School of Media, Communication and Sociology, at the University of Leicester. offered an alternative way of viewing the gap. He presented a simplified chart (Figure 2), which shares key characteristics with Figure 1. In Figure 2, both the upper and lower groups increase from the start time to the end date and a constant gap is maintained; in this case it’s 30 percentage points.
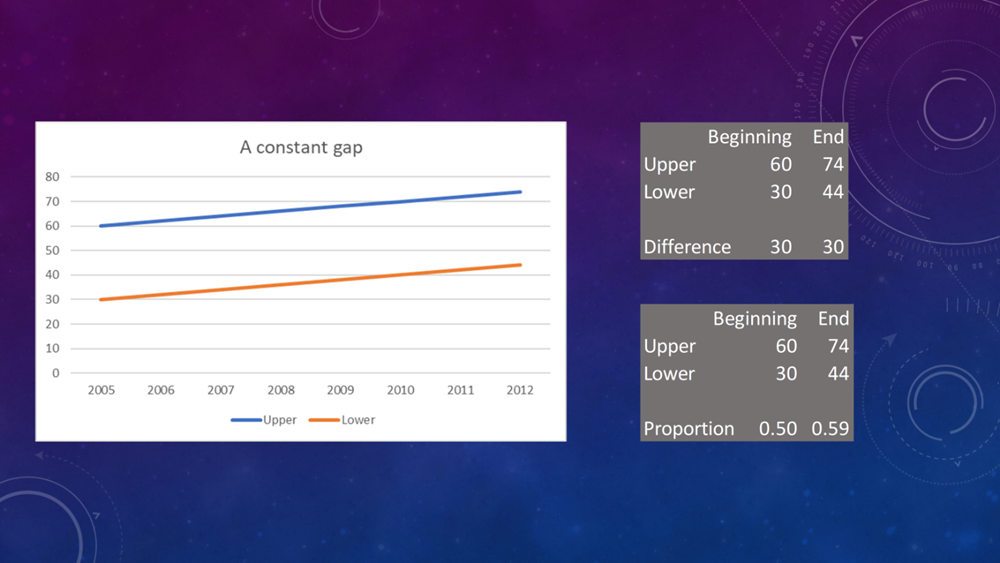
In Figure 3 however, David has added a second analysis box which sets out the same data as proportions. At the beginning the proportion of LSEGs who visit museums compared to the proportion of USEGs is a ratio of 30:60, or 50%. At the end of the period, the proportion is a ratio of 44:74, or 59%. Thus while the gap in absolute terms is constant at 30 percentage points, in proportional terms it has been reduced by 9 percentage points. Or to put it another way, while attendance in both groups increased by 14 percentage points, the increase in LSEG attendance from 30% to 44% is a greater increase proportionately than the USEG increase from 60% to 74%.
This raised many questions for the workshop , which will become part of the draft research agenda for the sector, which will be one of the outputs of the network. These include:
- What is the basis for the network’s assumption that each museum should have a visitor demographic that is representative of its catchment population (whether local, regional or nation, within the UK – the analysis excludes tourists, who tend to be better off and better educated than average)?
- Does the persistent attendance and benefit gap matter, if the proportion of LSEGs is increasing more than the proportion of USEGs?
- Or, to put it more broadly, what are the obligations of museums, as public service organisations, in relation to the demographic composition of their visitors, as compared to that of their catchment population?
- How do these changes relate to the absolute and relative numbers of USEGs and LSEGs in the population?
- Is there any evidence of the degree to which these changes in participation levels are driven by changes in how museums operate and/or by changes in the wider society?
- For example, given that we know that level of educational attainment is the single most important predictor of museum visiting, has the overall level of educational attainment at a population level changed over this period?
- How calibrated is the impact of level of educational attainment i.e. does the level of visitation increase with each increment of educational attainment, or are their significant thresholds in educational attainment which predict museum visiting?
- How are we to understand the primary influence of education, and, would understanding it in more sociological depth, help us attract and sustain hitherto excluded audiences?
- The Taking Part Chart (Figure 1) is shows the socioeconomic patterns for people who visit at least once a year; what are the patterns for people who visit more frequently? Have LSEG visits increased as occasional visits by a large number of people, or more frequent visits by a smaller number?
- How do these broad patterns play out for individual museums?
- How can individual museums use these sociological understandings to attract a more representative audience?
Some of these questions are ethical, philosophical, relating to public service duties. Others are sociological, about understanding visiting and non-visiting in more depth, especially in terms of the interaction of museum activities and socioeconomic and cultural changes in the wider population. The network intends to distil these questions into a practical Workbook which will enable museums to relate their vision and mission to their audience development strategies and to the demographic characteristics of their catchment population.
A Note of the Network Title: Attendance and Benefit
It may be worth saying a few words about the title of the workshop, which may seem tautologous, because it includes the words Benefit as well as Attendance. Surely the benefits of attendance map perfectly onto attendance? We intentionally included both terms in order to point out that this is an assumption, rather than something that has been evidenced systematically. It may be, for example, that different social groups derive different kinds of benefit from museum visiting, or that they get the same kinds of benefit but value them differently. Or that the kinds of benefits identified and surveyed (or otherwise studied) by museums and scholars may be different from those experienced and valued by different social groups. Exploring these issues is a key part of the research agenda.